
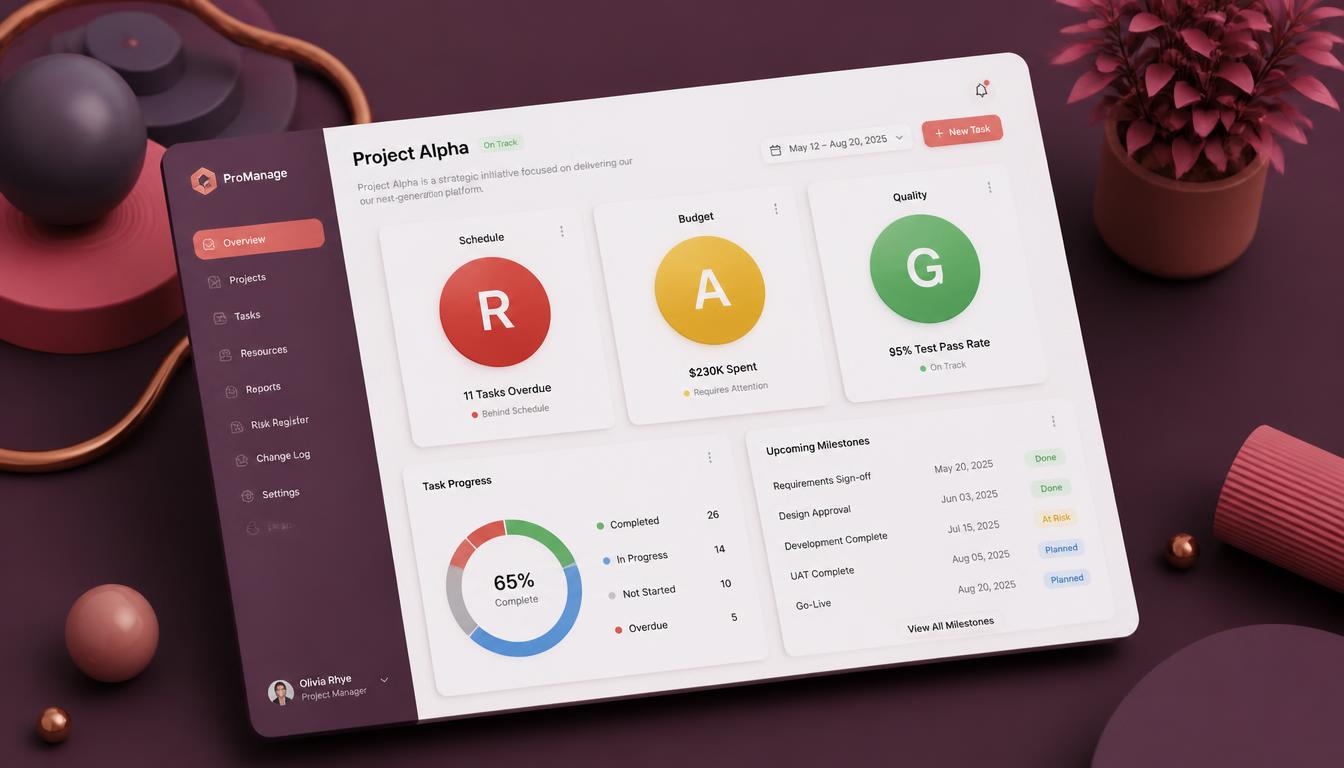

Ask five different PMs how they determine whether a sprint is Green, Amber, or Red, and you’re likely to get five different answers. In most cases, determining RAG status relies on gut instinct masquerading as data – and that’s an issue. If a founder or product owner sees ‘Amber’ in the RAG column, they reasonably expect it to be based on some objective and specific criteria. Once it’s revealed to be subjective, the trust in the RAG status is lost the first time it doesn’t match reality.
This is a common scenario where a sprint has been reported as Green, but a founder discovers on Thursday that a critical bug was carried over or that a key feature was omitted. Once that happens, the next RAG ‘Green’ is met with skepticism and requests for the underlying data from the PM. A formulaic approach isn’t about bureaucracy; it’s the ability to stand behind the color of your status.
The solution is to define clear thresholds for your RAG as a formula before the sprint starts – and not during the report. Below is a commonly used repeatable approach based on the three most relevant inputs to sprinting (schedule variance, quality of bugs, and velocity).
Why Gut Feeling RAG Status Fails
Before diving into the formula, it’s useful to highlight the issues without one:
- Different PMs on the same program may report the same situation differently, breaking report consistency
- Stakeholders lose trust in the RAG status once a ‘Green’ sprint turns out to have no warning for stakeholders
- Without clear thresholds, the RAG status is a reactive indicator instead of predictive
- Teams feel pressured or incentivized to manipulate the color of the RAG based on their conversations with the founder
A formulaic approach to your RAG solves all four, because the color reported is derived from data, not how the conversation with the founder went that week.
The 3 Inputs That Should Drive Your RAG Status
1. Progress Variance
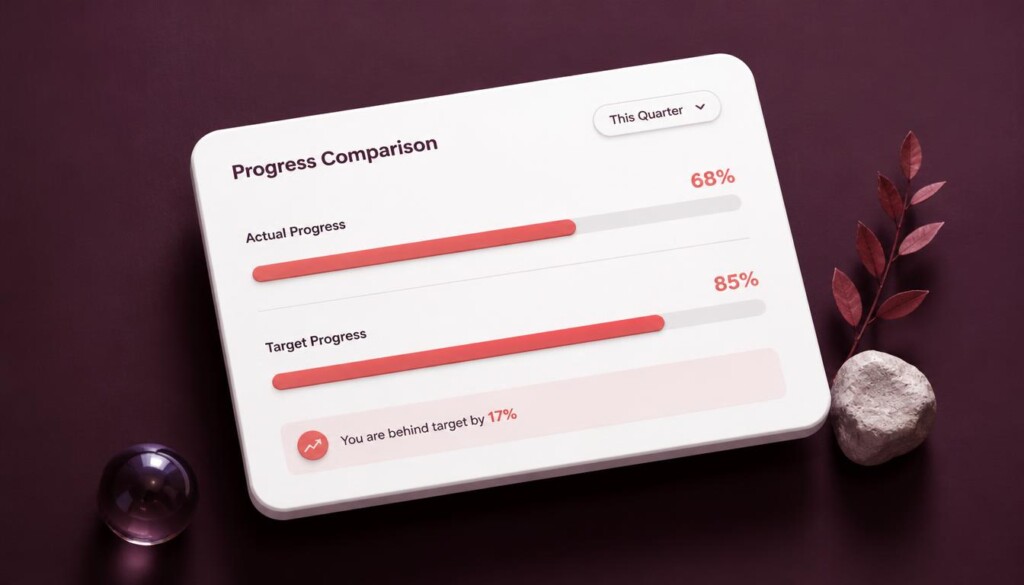
Compare the actual schedule of your sprint/milestone to the planned schedule.
Formula: Progress Variance (%) = Actual % Complete − Planned % Complete
Compare the actual percentage of planned work completed with the percentage that should have been completed by the reporting date. This simple progress measure is intended for sprint and milestone reporting; it is not the earned-value Schedule Variance (SV) formula.
🟢 Green: ≥ −5%
🟡 Amber: < −5% and ≥ −15%
🔴 Red: < −15%
2. Open Bug Ratio
Compare open bugs to total bugs identified this sprint, and separately flag any open critical/blocker bugs.
Formula: Open Bug Ratio = Open Bugs ÷ Total Bugs Identified
🟢 Green: ≤ 10%
🟡 Amber: > 10% and ≤ 25%
🔴 Red: > 25%, or any open critical/blocker bug
Edge case: If no bugs were identified, the open bug ratio is undefined because the denominator is zero. Report it as N/A rather than 0%, and assess quality using the available test results and coverage information. Always flag open critical or blocker bugs separately.
3. Velocity Attainment

Compare actual completed story points to committed story points for the sprint.
Formula: Velocity (%) = Actual Story Points ÷ Committed Story Points
🟢 Green: ≥ 90%
🟡 Amber: ≥ 70% and < 90%
🔴 Red: < 70%
Use velocity carefully: Compare completed and committed story points within the same team, using a consistent estimation approach. Story points are team-specific; they should not be used to rank different teams or treated as a direct measure of individual productivity. Velocity is one planning signal, not a substitute for evaluating the value and quality of the increment.
How to Combine the Three Inputs Into One Overall Status
Once you have a color for schedule, quality, and velocity individually, don’t average them; that hides real problems. Instead, use the cascade rule: your overall RAG status is the single worst color among the three.
- If schedule is Green, quality is Green, but velocity is Red, your overall status is Red.
- This prevents a strong schedule number from masking a genuine quality or delivery-capacity problem.
A quick worked example: If in a sprint Actual Complete is 78% against a Planned 85% (a -7% variance – Amber), with no open critical bugs and a 12% open bug ratio (Amber), and a Velocity of 94% of committed story points (Green) – the cascade rule applies the worst single input (Schedule and Quality), and your overall sprint is Amber. That’s the value of calculating each of the three inputs separately: a single healthy input cannot offset two real warning signs.
It’s exactly this approach that is applied to the RAG Status slide of my Weekly Project Status Report Template, where scope, schedule, budget, and quality are tracked as different colored inputs.
Quick Self-Check 🎯
Using the quick calculation above, run your current sprint through the formula:
- Calculate your schedule variance using actual vs. planned % complete
- Calculate your open bug ratio, and check for any open critical bugs
- Calculate velocity % against committed story points
- Combine the three with the cascade rule – your overall status is the worst of the three
All three Green? You’re in genuinely good shape, not just optimistic shape.
Get the Template
Rather than recalculating this manually every week, the PM Toolkit for Web & App Teams and the Weekly Project Status Report Template both have a ready-made RAG status structure for you to plug these numbers directly in.
Related read: 9 Powerful Slides Your Weekly Status Report Template Needs to Impress Founders
Related read: 7 Sprint Planning Templates That Save Web & App Teams From Chaos
Frequently Asked Questions (FAQ)
Are RAG thresholds consistent across different teams?
No. The percentages above are a good starter baseline, but teams with highly volatile scope (new products, R&D-heavy work) may want broader Amber bands than mature, stable teams.
What’s a situation where schedule and velocity disagree?
A sprint can appear on schedule by its target date but still be behind on completed work. For example, if scope was reduced during the sprint. Under the cascade rule used in this article, any Red input makes the overall status Red. Investigate why the indicators disagree, explain the impact, and agree on corrective action with the team and stakeholders.
How does TPM-level RAG differ from a single team PM’s RAG?
At the program level, a Technical Project Manager (TPM) can roll up individual team statuses using an explicitly defined aggregation rule. If the same worst-status cascade rule used in this article applies, one Red team makes the overall program status Red. Organizations may use different program-level rules, but they should document those rules in advance and apply them consistently.
What about scope and budget; shouldn’t those be factored into the RAG?
They absolutely should, and many teams use the same RAG framework against a 4th and 5th input (a scope-change count threshold, and a budget-burn-rate percentage, respectively) – this tutorial focuses on schedule, quality, and velocity because it’s the three inputs available from the sprint data, without needing finance or scope-change tracking systems, but the same cascade rule applies cleanly if you add more dimensions.
Your Turn 💬
Does your current status reporting make use of defined thresholds like this, or is RAG status still more of a subjective call on your team? Throw a comment below, and I’ll read every one.
