
Introduction
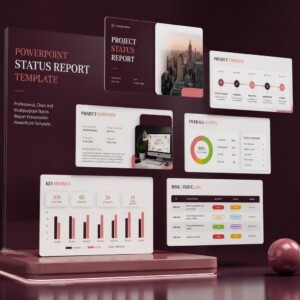
Before jumping into the 9 slides that I’m about to discuss, let me start off with a few pieces of advice. Nothing demoralizes confidence in a project like an unclear, messy, or absent status update that doesn’t include the one number someone cares about, and nothing wastes the Friday afternoon of a PM faster than rebuilding the report.
From my own experience reporting to rooms with product owners and company founders, I’ve found a major difference between a report that’s skimmed and ignored versus one that drives decisions always comes down to structure, not content. The information is almost always present; it’s just buried or presented in a way that doesn’t support a busy executive in scanning it in 30 seconds.
Founders and product managers need reassurance that sprint goals are progressing according to plan, and a report that is predictable and highly readable can help achieve this without the need to call unnecessary status meetings.
Why Most Status Reports Fail
Before the slide breakdown, let’s name the key failure points:
- Too much detail vs. signal (a wall of Jira tickets is not a status update)
- No consistent structure across weeks, requiring readers to re-orient
- Risks and blockers buried in prose, not visualized
- No clear ask for stakeholders
Each of the slides below solves one of these problems.
The 9 Essential Slides
1. Cover Slide
Project name, reporter name and title, reporting date, sprint number, and version. This seems basic, but a consistent cover format is what makes a report feel like part of a series instead of a one-off document, building trust over time.
2. Executive Summary
The single most important slide. Here we’ll state the current milestone, target date, and an honest one-liner health check, all before someone has to scroll or dig. This is a slide a founder reads even if they skip everything else.
Make sure to keep this slide concise with three key elements:
- Overall sprint or release target date
- Progress percentage versus planned milestones
- Key achievements or critical dependencies needing immediate attention
3. RAG Status
Red, Amber, Green indicators for scope, schedule, budget, and quality. Color-coded status is processed by the brain faster than text, which is important when your audience is scanning, not reading.
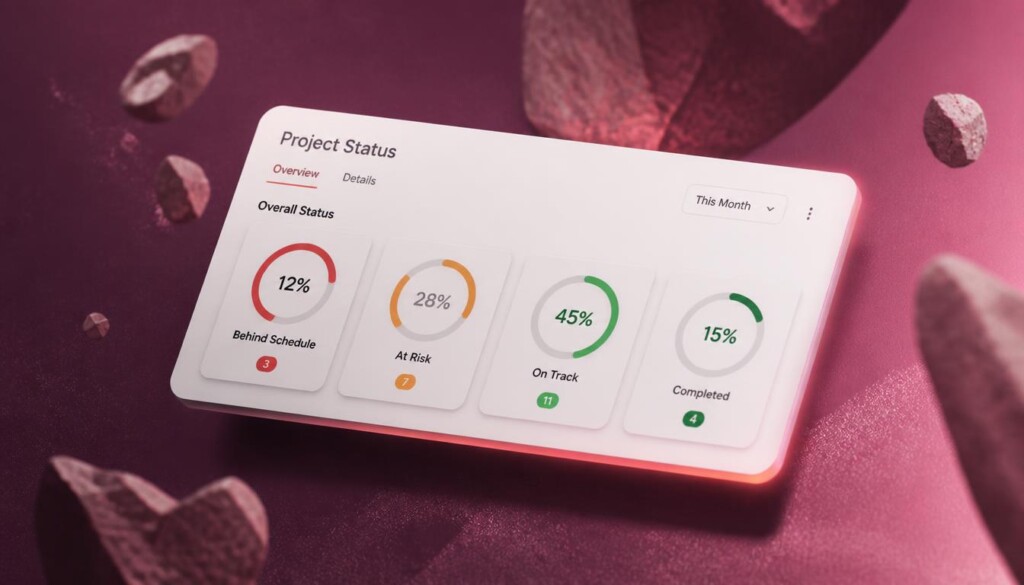
To keep your status objective, define strict criteria for each color indicator:
- Green: On track with no major blockers or schedule variance.
- Amber: Minor delays or active risks that require monitoring but have mitigation plans in place.
- Red: Critical blockers, severe scope creep, or schedule delays that require founder or stakeholder intervention.</li>
4. Progress Overview (Actual vs. Target)
A simple bar chart comparing actual progress to the original target, for both the milestone and the current sprint. Numbers alone don’t communicate whether you’re ahead or behind; a visual comparison does that instantly.
5. Completed Tasks
A clean list of what shipped this sprint, tagged by team. This is the slide that shows momentum, and it’s often the most skimmed but most appreciated section by product owners who want proof of forward motion.
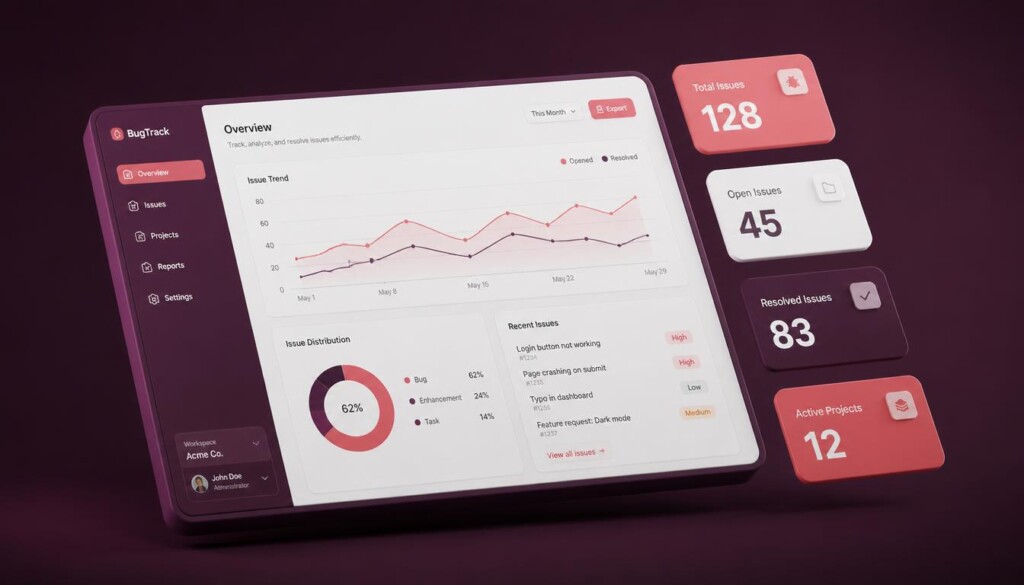
6. Bug Status
How many bugs were identified, how many were resolved, how many are still being verified, and how many are carrying forward. This single slide answers the question every stakeholder is quietly wondering: is quality under control?
7. Risk Register
Severity, affected area, status, owner, and mitigation plan for every active risk. This slide alone can make a difference between a founder feeling blindsided later and a founder feeling like risks are actively managed.
A functional risk register should categorize issues by likelihood and business impact. Differentiate clearly between an active risk (a potential problem that might happen) and an issue (a problem that is happening right now). This distinction helps executives understand where to allocate resources quickly.
8. Issues Overview
Grouped into resolved, ongoing, and known low-priority issues. This provides a fuller picture than a bug list alone, capturing things like environment flakiness or vendor delays that don’t fit neatly into a bug tracker.
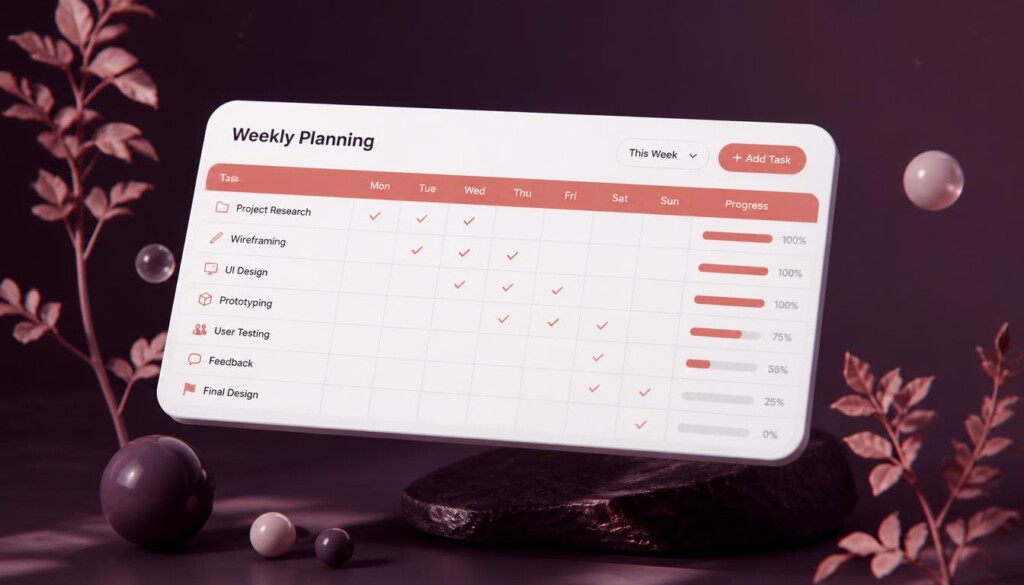
9. Next Week’s Plan
Title, description, and target date for what’s coming next. Closing on forward-looking content (rather than ending on problems) leaves stakeholders with a sense of direction, not just a list of issues.
Quick Self-Check 🎯
Before your next report goes out, check:
- Does the executive summary answer “are we on track?” in one line?
- Is RAG status color-coded, not just described in text?
- Does the risk register have an owner and mitigation for every open item?
- Does the report end on next steps, not just problems?
Missing more than one? That’s precisely what a structured template fixes.
Get the Template
I’ve packaged this exact 9-slide structure, in an easy brand-color layout, as a ready-to-use PowerPoint template – including a fully filled-out example deck so you can see it in action before editing a single slide.
Weekly Project Status Report Template (PowerPoint)
On a related note, you can also check out additional templates here that may also be useful for your sprint planning sessions.
Frequently Asked Questions
How often should a weekly status report actually go out?
Weekly is standard for most agile teams, though bi-weekly can work if your sprint cadence is longer. Consistency in timing matters more than frequency.
Should status reports be shared with the whole team, or just stakeholders?
Most teams benefit from a version for internal team visibility, and a slightly more curated version (this structure) for founders and product owners, as the audience needs are different.
What’s the biggest mistake PMs make in status reports?
Leading with detail instead of the headline. Always put the “are we on track” answer first, then let stakeholders drill into detail if they want it.
What is the ideal length for a weekly status presentation?
A good weekly status deck should take no more than 5 to 10 minutes to present live. If you send it asynchronously via email or Slack, stakeholders should be able to scan all key metrics within 2 minutes.
How do I handle delivering bad news or a Red RAG status?
Be direct and transparent. Present the issue on the RAG status and Risk slides alongside proposed solutions and clear action items. Founders respect project leads who surface problems early with actionable solutions rather than hiding delays until deadlines are missed.
Your Turn 💬
What’s the one thing your current status report is missing? Drop a comment below; I read every one.